

Financial Projections for Startups: Build Realistic Models in 2025
If the idea of creating financial projections fills you with dread, you are not alone. For curious beginners, terms like “cash flow” and “balance sheet” can feel like a foreign language. For seasoned professionals, the challenge is often shifting from corporate budget precision to the art of informed, startup estimation. What I’ve found, after building models for ventures that have gone on to raise millions and those that have quietly closed shop, is that the most valuable financial projections are not about predicting the future with pinpoint accuracy. They are about telling a believable, data-informed story of your business’s potential and building a crucial early-warning system. In 2025, with economic uncertainty still a factor, the ability to model your finances isn’t just for investors—it’s your primary tool for survival and strategic decision-making.
This guide will decode the three core statements—Cash Flow, Profit & Loss (P&L), and Balance Sheet—into plain language. I’ll provide you with a logical, step-by-step process to build your own realistic projections, even if you’ve never opened an accounting textbook. We’ll move beyond theory to practical templates and the mindset you need to create numbers you can actually trust and use.
Introduction: Why Your Best Guess Isn’t Good Enough
Financial projections are the quantitative expression of your business plan. They translate your vision for customer acquisition, pricing, and operations into the universal language of money. In my experience, founders who skip this step or treat it as a cursory exercise are flying blind. They run out of cash without seeing it coming, make hiring decisions based on emotion rather than data, and are utterly unprepared for investor scrutiny. A 2025 report by CB Insights, which analyzes startup failures, still cites “running out of cash” as the #2 cause of death, often stemming from flawed financial planning. This isn’t about complex finance; it’s about fundamental cause and effect. If you spend $5,000 on marketing to acquire 10 customers who each pay you $50 per month, how long can you sustain that? The answer lies in your projections.
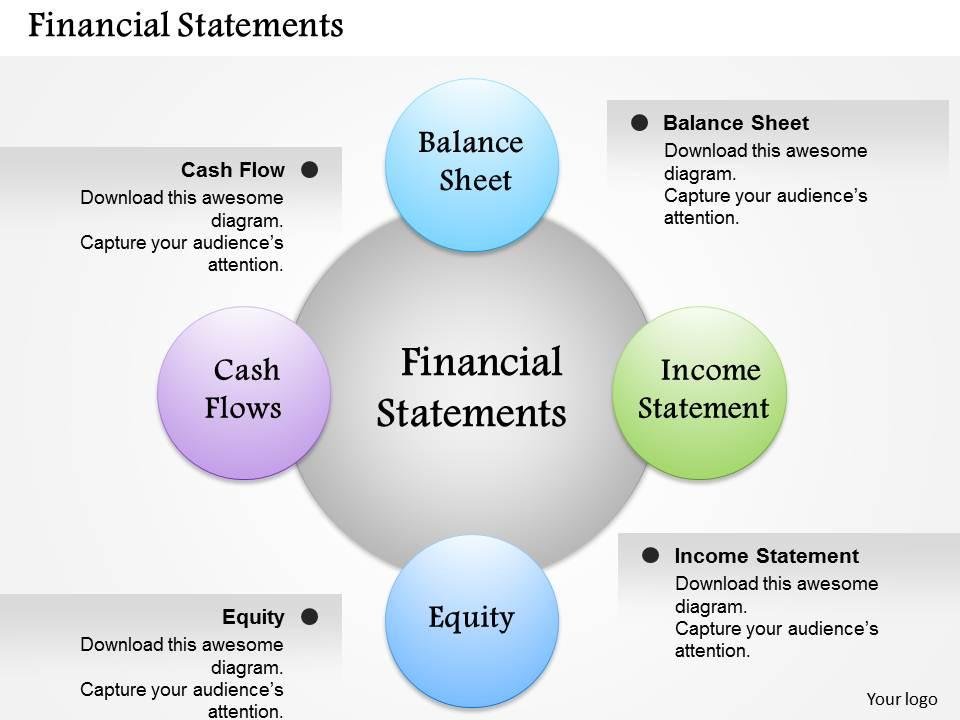
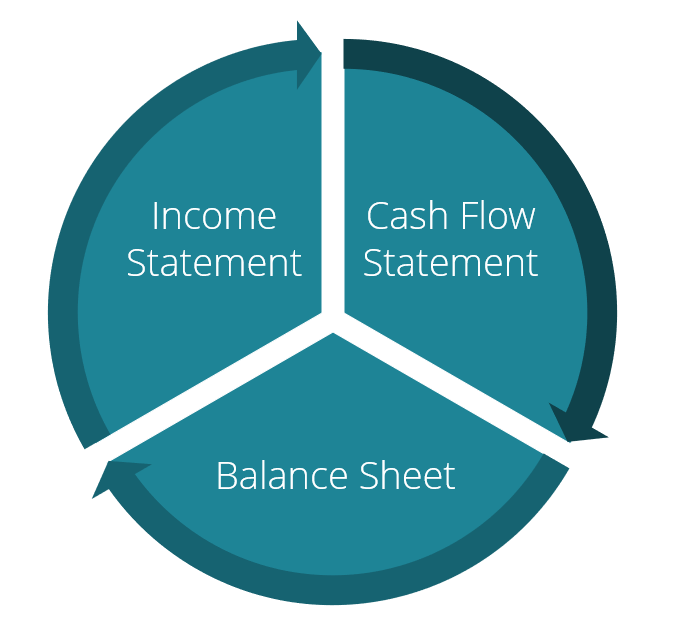
Background: The Trinity of Financial Statements
In the corporate world, these statements are historical records, audited and precise. For a startup, they are forward-looking models—your best estimate of the financial future. Each serves a distinct purpose:
- Profit & Loss (Income Statement): Shows your profitability over a period (month, quarter, year). It answers: Are we making money on paper?
- Cash Flow Statement: Shows the actual movement of cash in and out of your business. It answers: Do we have enough cash in the bank to pay our bills?
- Balance Sheet: Shows your financial position at a single point in time. It answers: What is the company worth, and what do we own vs. owe?
The critical insight for entrepreneurs is that these three are deeply interconnected. A change in one (like a sale on credit) immediately affects the others. Understanding this interplay is the key to avoiding catastrophic cash shortages even when your P&L looks profitable.
Key Concepts Defined
- Revenue (Sales): The total income generated from normal business operations (selling products/services). This is the top line.
- COGS (Cost of Goods Sold): The direct costs attributable to producing the goods or services sold (e.g., raw materials, manufacturing labor, shipping). Gross Profit = Revenue – COGS.
- Operating Expenses (OpEx): The costs of running the business that are not directly tied to a single unit of sale (e.g., rent, salaries for admin staff, marketing, software subscriptions).
- Burn Rate: The rate at which a new company is spending its venture capital to finance overhead before generating positive cash flow from operations. Usually expressed as a monthly net cash loss (e.g., “We are burning $20,000 per month”).
- Runway: The amount of time (usually in months) a company has before it runs out of money, assuming income and expenses remain constant. Runway = Cash Balance / Monthly Net Burn.
- Accounts Receivable (AR): Money owed to your business by customers for goods/services delivered but not yet paid for.
- Accounts Payable (AP): Money your business owes to suppliers/vendors for goods/services received but not yet paid for.
- Accrual vs. Cash Accounting: Accrual accounting records revenue when it’s earned and expenses when they’re incurred (standard for projections/P&L). Cash accounting records transactions only when cash changes hands (the reality of your bank account, reflected in Cash Flow).
How It Works: Building Your Financial Model from the Ground Up
Follow this sequence. Never start with a wishful revenue number and work backward.
Step 1: Start with Your Unit Economics (The Foundation of Everything)
This is the most crucial step most founders miss. Define the fundamental financial metrics of one unit of your business.
- For an E-commerce Product: Customer Acquisition Cost (CAC), Average Order Value (AOV), Cost to Make/Ship One Unit.
- For a SaaS Company: Cost to Acquire a Customer (CAC), Monthly Recurring Revenue per Customer (MRR), Cost to Serve One Customer (hosting, support).
- For a Service Business: Billable Rate per Hour/Day/Project, Direct Labor Cost per Hour, Cost to Land One Client (sales/marketing).
Example from my experience: A client selling a $99 subscription box had a unit cost of $45 and a CAC of $60. Their gross profit per unit was $54, but it took them 7 months of the $99 subscription to recoup the $60 CAC. This unit economic reality drove their entire cash flow model.
Step 2: Build Your Revenue Forecast (The “Top-Down” Trap)
Avoid the “We’ll get 1% of a billion-dollar market” trap. Build your forecast bottom-up.
- List Your Revenue Streams: Product sales, subscription tiers, service packages.
- Define Drivers: What activity drives revenue? (e.g., Number of New Customers, Number of Repeat Purchases, Average Price).
- Make Assumptions: Be ruthlessly realistic. How many website visitors will you get? What’s your conversion rate? How many sales calls can you make per month? Base these on initial data, competitor benchmarks, or conservative guesses. Project this month-by-month for at least 12 months.
Step 3: Forecast Your Cost of Goods Sold (COGS)
These costs should scale directly with your revenue forecast. If you sell 100 more units, how much do your direct costs increase? This gives you your Gross Margin (Gross Profit / Revenue). A healthy, scalable gross margin is often a key investor metric.
Step 4: List Your Operating Expenses (The “Burn”)
Categorize these as Fixed (rent, salaries) and Variable (marketing ads, transaction fees). Start with the essentials needed to operate. Be detailed. Don’t lump “miscellaneous.” Include a contingency line (5-10%).
Step 5: Construct Your Monthly Profit & Loss (P&L) Statement
Now, assemble Steps 2-4 into a monthly table.
- Line 1: Revenue
- Line 2: COGS
- Line 3: Gross Profit (Line 1 – Line 2)
- Line 4: Operating Expenses (list them)
- Line 5: Operating Profit (EBITDA) (Line 3 – Line 4)
- Line 6: Interest, Taxes, Depreciation (simplify early on)
- Line 7: Net Profit/Loss
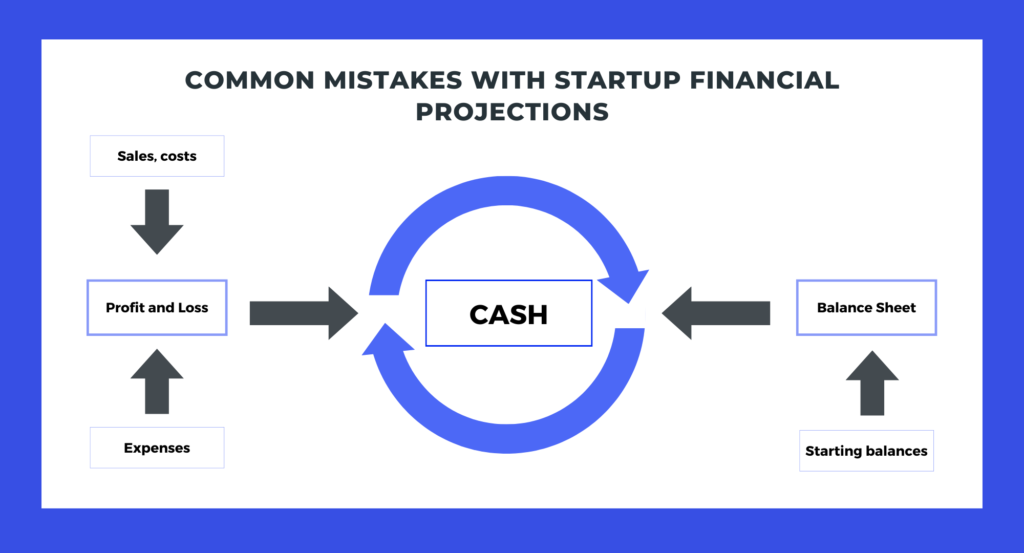
Step 6: Build Your Cash Flow Forecast (Your Reality Check)
This is where the P&L meets the real world. Create a separate monthly table.
- Starting Cash Balance (from your bank).
- Cash Inflows: Actual cash received (consider payment delays on invoices).
- Cash Outflows: Actual cash paid out (consider when you pay vendors, rent, salaries).
- Net Cash Flow (Inflows – Outflows) for the month.
- Ending Cash Balance (Starting Balance + Net Cash Flow). This Ending Balance becomes the next month’s Starting Balance.
The shocking moment for many founders is when they see their P&L show a profit in Month 6, but their Cash Flow Forecast shows a negative balance because they had to pay for inventory upfront in Month 3.
Step 7: Create Your Opening Balance Sheet and Project It Forward
At startup, this is simple.
- Assets (What you own): Cash, Inventory, Equipment.
- Liabilities (What you owe): Loans, Credit Card Debt.
- Equity (The owner’s claim): Your initial investment (cash you put in) + Retained Earnings (your accumulated profits/losses from the P&L).
The fundamental equation: Assets = Liabilities + Equity.
Each month, update the Balance Sheet using your P&L and Cash Flow results. The “Cash” asset comes from your Cash Flow statement. The “Retained Earnings” equity comes from your Net Profit/Loss.
Why It’s Important: More Than a Fundraising Document
Realistic financial projections are your business’s flight simulator. They allow you to stress-test decisions before you make them.
- Manage Cash: They prevent the #1 startup killer by clearly showing your future cash position and runway.
- Make Strategic Decisions: Should you hire a salesperson? Your model can show if the revenue they generate will cover their salary and CAC before you run out of cash.
- Set Measurable Goals: They turn vague ambitions (“grow sales”) into specific, monthly targets.
- Attract Investment: They demonstrate financial literacy and show you understand the levers of your business. For more on preparing for that investor partnership, see our guide on strategic alliance models.
- Build Credibility: With partners, vendors, and early employees, showing you have a financial plan inspires confidence.
Sustainability in the Future: Dynamic, Data-Linked Models
The future of startup financial projections is real-time integration. Static Excel files are giving way to cloud-based tools that link directly to your business accounts (Stripe, QuickBooks, bank feeds). Your revenue forecast can auto-adjust based on actual sales trends, and your cash flow can update daily. In 2025, AI is beginning to be used for scenario analysis, automatically answering “what-if” questions like, “What happens to my runway if my supplier costs increase by 15%?” The sustainable model is a living document that is constantly tuned to reality, requiring less manual upkeep and providing more accurate, timely insights.
Common Misconceptions
- Misconception: “Financial projections are lies because you can’t predict the future.” Reality: Their value is in the process, not the precision. The act of building them forces you to question every assumption. They are a set of hypotheses to be tested and updated monthly.
- Misconception: “If the P&L shows a profit, we’re safe.” Reality: Profit is an accounting concept. Cash is king. You can be profitable and bankrupt if your cash is tied up in inventory or unpaid invoices.
- Misconception: “I need an accountant to do this.” Reality: You, the founder, must understand and own the model. An accountant can later help with compliance and optimization, but the strategic assumptions must be yours. You can start with our foundational resources.
- Misconception: “My projections need to be ultra-aggressive to impress investors.” Reality: Sophisticated investors spot unrealistic hockey-stick growth instantly. They prefer conservative, believable projections with clearly explained assumptions. They invest in the team and the problem, not a fantasy spreadsheet.
Recent Developments: The Emphasis on Unit Economics and Path to Profitability
Post-2023, investor sentiment has sharply pivoted away from “growth at all costs” to “efficient growth.” The recent development isn’t a new financial formula, but a change in what metrics are scrutinized. Investors now demand a clear, detailed understanding of Unit Economics and a believable Path to Profitability (often within 3-5 years). Your projections must clearly show how and when the lifetime value (LTV) of a customer surpasses the cost to acquire them (CAC), and how scaling will eventually cover all operating expenses. Narratives around “capturing market share” are no longer sufficient without this underlying financial rigor.
Success Story: The Pivot Powered by a Projection
A software startup (a “Uber for laundry”) had an initial model based on taking a 25% commission on each transaction. Their P&L looked promising, but their cash flow forecast revealed a fatal flaw: they had to pay laundry partners weekly, but users paid on a monthly credit card cycle. This created a severe, growing cash squeeze as they scaled. By modeling this, they saw they would need millions in working capital just to fund this gap. This projection didn’t kill the business; it saved it. They pivoted their entire revenue model to a SaaS subscription for laundry partners, with a smaller transaction fee. This dramatically improved their cash flow profile, making the business viable and ultimately fundable. The projection was the catalyst for a necessary, foundational pivot.
Real-Life Examples
- Freelance Consultant:
- Revenue Driver: Billable Hours/Mo. x Rate.
- Key Assumption: Utilization Rate (% of time billed).
- Cash Flow Watch Point: Invoicing clients and payment terms (Net 30, Net 60). Your runway must cover the gap between doing work and getting paid.
- Subscription Box Company:
- Revenue Driver: Subscribers x Monthly Price.
- Key Assumptions: Monthly Churn Rate, Cost of Goods per Box.
- Cash Flow Watch Point: Upfront inventory purchase. You must buy 3 months of inventory before you have 3 months of subscriber revenue to pay for it.
- Mobile App:
- Revenue Drivers: In-App Purchases, Ad Revenue.
- Key Assumptions: Daily Active Users (DAU), Conversion Rate to Paid, Revenue per User (RPU).
- Cash Flow Watch Point: High initial development cost (burn) with delayed, uncertain revenue. Runway is critical.
Conclusion and Key Takeaways
Financial projections are not a crystal ball but a compass and a calculator. They won’t tell you exactly what will happen, but they will tell you what needs to happen for your business to succeed and whether your current path is leading you toward a cliff. Embrace them as a learning tool, not a report card. The discipline of monthly review and revision—comparing your actual results to your projections—is where the deepest entrepreneurial insights are born.
Key Takeaways:
- Start with Unit Economics: Understand the financial story of one customer before you model a thousand.
- Build Bottom-Up: Base revenue on actionable drivers, not market percentages.
- Cash is Fact, Profit is Opinion: Model your cash flow statement with obsessive detail; it’s the one that determines survival.
- Assumptions are Everything: Document every single assumption behind your numbers. This turns your model into a discussion tool, not just a spreadsheet.
- Update Relentlessly: A financial model is a living document. Review it against actuals monthly and adjust your assumptions and plans accordingly.
For a step-by-step guide on launching the venture these projections will guide, explore our complete guide to start an online business.
Frequently Asked Questions (FAQs)
1. How far out should I project?
For early-stage startups, a detailed 12-18 month monthly projection is most practical, with annual summaries for years 2 and 3. Beyond 3 years is largely speculative.
2. What’s the single most important number in my projections?
Runway. Knowing how many months of cash you have left dictates every urgent priority.
3. Should I project in Excel, Google Sheets, or special software?
Start with Google Sheets. It’s accessible, shareable, and sufficient for most early models. Specialized software (like LivePlan, Fathom) becomes useful later for automation and advanced reporting.
4. How do I estimate my initial sales? It feels like guessing.
It is informed guessing. Start with your immediate network, pilot programs, or minimum viable traction. Use industry benchmarks for conversion rates cautiously. The key is to document the assumption (“We assume a 2% website conversion rate”) and then track the real number to improve the guess.
5. What are “one-time” vs. “recurring” costs?
Capital Expenditures (CapEx) are one-time purchases of significant assets (e.g., a laptop, machinery). Operating Expenses (OpEx) are recurring costs of running the business (e.g., rent, SaaS subscriptions). In cash flow, CapEx hits hard in one month.
6. How do I account for funding (e.g., a loan or investment) in the model?
A loan appears on the Balance Sheet as a Liability (loan payable). The cash received is an Inflow on the Cash Flow statement. Repayments are Outflows (principal reduces the liability, interest is an expense on P&L).
An equity investment increases Cash (Asset) and increases Equity on the Balance Sheet. It is not revenue on the P&L.
7. What is a “cap table” and is it part of projections?
A capitalization table lists all the company’s securities (shares, options) and who owns them. It’s separate from your financial projections but is crucial for understanding ownership dilution when you raise money. It’s part of your overall financial picture.
8. How often should I update my financial model?
Formally, every month, after you close your books for the prior month. Informally, you should run “what-if” scenarios whenever considering a significant decision (hiring, new product, price change).
9. What is a “scenario analysis” (Best Case/Worst Case)?
It’s creating multiple versions of your projections based on different assumptions. “Base Case” (realistic), “Worst Case” (slow growth, high costs), and “Best Case” (fast growth). This shows you the range of possible outcomes and prepares you for volatility.
10. What’s the difference between COGS and Operating Expenses?
COGS is directly tied to producing your product/service. If you make shirts, COGS is fabric and labor to sew. OpEx is everything else to run the business: marketing, your salary as CEO, office rent. If you stop production, COGS should go to zero; OpEx may continue.
11. How do I project for a pre-revenue startup?
Your revenue line may be $0 for many months. Focus intensely on modeling your burn rate (all your OpEx + any CapEx) and your resulting runway. Your key milestones will be tied to activities that eventually generate revenue (e.g., launch MVP, acquire first pilot customers).
12. What is “EBITDA” and why is it important?
Earnings Before Interest, Taxes, Depreciation, and Amortization. It’s a rough proxy for operating cash flow and is used to compare the profitability of companies across different industries and tax structures. Investors often look at it.
13. How do I handle taxes in my projections?
Initially, keep it simple. Consult an accountant for specifics. A common simple method is to reserve a percentage of your estimated profit (e.g., 20-30%) in a separate bank account for future tax liabilities. Show it as an expense in the month you expect to pay it.
14. My business is seasonal. How do I project that?
Build your monthly model based on historical seasonal patterns if you have them. If you’re new, research your industry’s seasonality. Don’t spread annual revenue evenly across 12 months. Model the peaks and troughs, as they have a massive impact on cash flow (you must save during peaks to cover troughs).
15. What are “key assumptions” I should list?
List anything that drives a major number: Customer Growth Rate, Churn Rate, Average Sale Price, Customer Acquisition Cost, Inventory Days, Payment Terms from Customers/Vendors, Salary increases, Rent increases.
16. How do financial projections relate to my one-page lean business plan?
The one-page plan contains your high-level goals and strategies. The financial projections are the quantitative backup for that plan. The milestones in your lean plan should be directly reflected in the drivers of your financial model.
17. Can I use AI to build my financial projections?
AI (like ChatGPT Advanced Data Analysis) can help generate template structures, suggest formulas, and analyze data. However, the strategic assumptions must come from you. Use AI as a copilot to build the spreadsheet, but you are the captain defining the destination and route.
18. What’s a good gross margin to target?
It varies wildly by industry. Software can be 80-90%. Manufacturing might be 30-50%. Retail can be under 30%. Research your industry. The key is that your gross margin must be high enough to cover your operating expenses and leave a profit.
19. How do I project for a physical product business with inventory?
This adds complexity. You must model:
- Inventory Purchase: Large cash outflows when you order stock.
- COGS: You only recognize the cost of the inventory when it is sold (not when you buy it).
- Balance Sheet: Inventory sits as an Asset until it’s sold.
This creates a significant cash flow lag. Your model must ensure you have cash to buy Inventory 2 before you’ve sold all of Inventory 1.
20. What should I do if my projections show I’ll run out of cash in 6 months?
This is the primary purpose of the exercise! Now you have a 6-month warning. Your options: 1) Reduce burn (cut costs), 2) Increase revenue (focus on sales), 3) Raise funding (start now), or 4) A combination. The model lets you test which levers are most effective.
21. How detailed should my expense categories be?
Detailed enough to be actionable. “Marketing – $5,000” is bad. “Marketing: Google Ads – $2,000, Influencer Campaign – $2,000, Content Creation – $1,000” is good. You need to know what to adjust if you need to cut costs.
22. What is “depreciation” and how do I project it?
It’s the accounting method of allocating the cost of a physical asset over its useful life. If you buy a $1,200 laptop with a 3-year life, you might depreciate it at $33 per month. It’s a non-cash expense on the P&L (the cash outflow happened when you bought it).
23. Where can I find benchmarks for my industry?
Industry associations, reports from IBISWorld or Statista, SEC filings of public competitors (look at their 10-K reports), and articles from sources like World Class Blogs on business trends.
24. How do I present my projections to investors?
In a pitch deck, include only the highlights: 3-5 year summary P&L, key metrics (CAC, LTV, Burn, Runway), and perhaps a cash flow chart. Have the full, detailed model ready to send if they ask for it and be prepared to walk through every assumption.
25. What is “break-even analysis”?
It’s finding the point where total revenue equals total expenses (your net profit is zero). It’s a key milestone for sustainability. Your model should show which month you project to hit it.
26. Is it okay to change my projections?
Absolutely. In fact, it’s mandatory. If you learn that your CAC is twice what you projected, you must update the entire model to reflect that new reality. Sticking to old, wrong projections is dangerous.
27. How does global economic factor into my projections?
For businesses dealing with imports/exports or foreign customers, factors like supply chain stability and currency exchange matter. It’s wise to include a risk assumption, e.g., “Assumes no major port delays” or “Assumes EUR/USD rate stable.” For a deeper dive, see this guide on global supply chain management.
28. What’s the role of mental stamina in this financial rigor?
Staring at potentially grim numbers monthly requires resilience. Founders must separate their self-worth from their startup’s financials. Maintaining perspective is critical for mental health, a topic covered well in this guide to psychological wellbeing.
29. Can I get a template for all of this?
Yes. We provide an integrated financial model template in our Sherakat Network Resource Library, built specifically for early-stage startups.
30. When should I hire a fractional CFO or accountant?
When the complexity of your transactions (payroll, multiple revenue streams, inventory, fundraising) is taking you more than a day a month to manage, or when you are preparing for a major fundraise. They can professionalize your model and ensure compliance.
About the Author
Sana Ullah Kakar is a reformed finance professional who left the world of Fortune 500 budgeting to help founders speak the language of money with confidence. With an MBA in Finance and a decade as a startup CFO and advisor, they have built, torn apart, and rebuilt hundreds of financial models. At Sherakat Network, they are passionate about demystifying finance, believing that a founder who understands their numbers holds the ultimate power to steer their venture. They’ve seen that the most elegant business idea fails without financial discipline, and the most modest idea can thrive with it. Their writing and coaching focus on the practical application of financial concepts, stripping away jargon to reveal the simple arithmetic of business success. Connect with them and our network of experts through our contact page.
Free Resources
From Sherakat Network:
- Integrated Financial Model Template: Download our startup-friendly, customizable Google Sheets template from our Resource Library.
- Planning Foundations: Pair your financials with a solid strategic plan using our guide to One-Page Lean Business Planning.
- Partner for Growth: Understand the financial implications of different partnership structures in our deep dive on business partnership models.
External Insights:
- Operational Excellence: Learn how financial planning intersects with physical operations in this guide to Global Supply Chain Management.
- Tech Context: See how cutting-edge AI and Machine Learning are changing business analytics and forecasting.
- Cultural Lens: Explore how broader cultural and societal trends influence market behavior and financial assumptions.
Discussion
What’s the most challenging part of creating financial projections for you? Is it the revenue assumptions, estimating costs, or understanding the interplay between the statements? Share your specific hurdles or “aha!” moments in the comments below. Let’s create a community where we can demystify startup finance together.
Best Landscaping Las Vegas